

Contents
Trade Setup for April 1: Top 15 things to know before the opening bell amid Iran war-driven uncertainty
After being oversold and with bears showing some signs of fatigue, the Nifty 50 may see a rebound towards 22,500–22,700; however, sustainability remains key going forward.
As the index is close to a rising support trendline, a decisive break could trigger a fall towards 22,000–21,700, according to experts.
Kashmir University Fresh Recruitment for Junior Assistant Posts
Nifty may see resistance at 22,500–22,700
Nifty close to a rising support trendline
Decisive fall below Monday’s low could trigger a fall towards 22,000–21,700
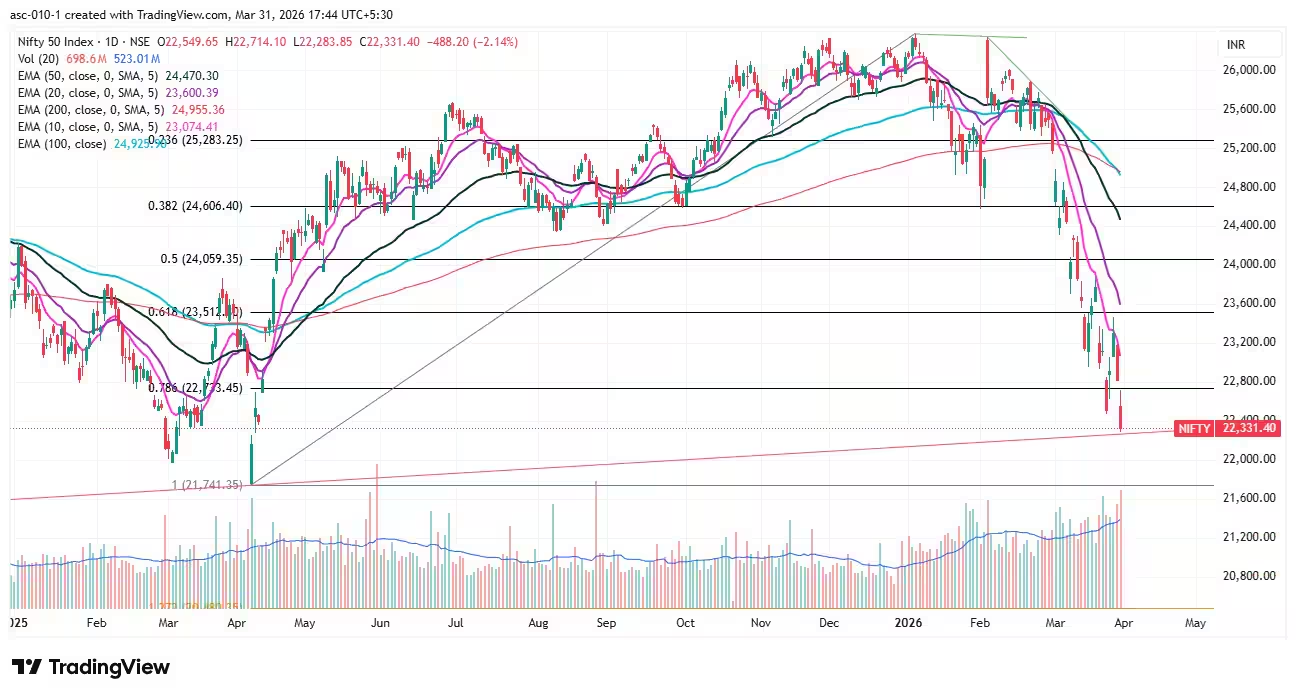
The Nifty 50 witnessed strong dominance of bears, falling over 2 percent for the second straight session amid high volumes on March 30, as uncertainty over the reopening of the Strait of Hormuz persisted amid the intensified West Asia war, while FII outflows have remained unstoppable since February 26.
Technically, the lower high–lower low formation and downward-sloping moving averages signal healthy bearish momentum, and it has been a particularly painful month for the markets.
JKSSB Fresh Divisional cadre Jobs Posts Advertised
After being oversold and with bears showing some signs of fatigue, the index may see a rebound towards 22,500–22,700; however, sustainability remains key going forward.
As the index is close to a rising support trendline, a decisive break could trigger a fall towards 22,000–21,700, according to experts.
Here are 15 data points we have collated to help you spot profitable trades:
1) Key Levels For The Nifty 50 (22,331)
Resistance based on pivot points: 22,607, 22,709, and 22,873
Special Formation: The Nifty 50 formed a long red candle with an upper shadow on the daily timeframe after a gap-down opening, signalling significant selling pressure. The lower top–lower bottom formation remains intact, while the index is 10.5 percent below its 200-day EMA (Exponential Moving Average), and all moving averages continue to slope downward. The RSI has remained below 40 since the start of March, while the MACD is sustained well below the signal and zero lines, with weakness in the histogram. All this indicates continued bearish bias.
2) Key Levels For The Bank Nifty (50,275)
Resistance based on pivot points: 51,249, 51,607, and 52,188
Support based on pivot points: 50,088, 49,729, and 49,149
Resistance based on Fibonacci retracement: 53,788, 55,312
Support based on Fibonacci retracement: 50,705, 47,696
Special Formation: The Bank Nifty formed a long red candle, continuing the lower high–lower low structure, and traded nearly 12 percent below its 200-day EMA, with all moving averages sloping downward. The index dropped below the 78.6 percent Fibonacci retracement level (of the rally from the March 2025 low to the January 2026 high). The RSI sustained below 40 throughout March, and the MACD stayed below the reference and zero lines, with a weakening histogram. All this indicates sustained bearish momentum.
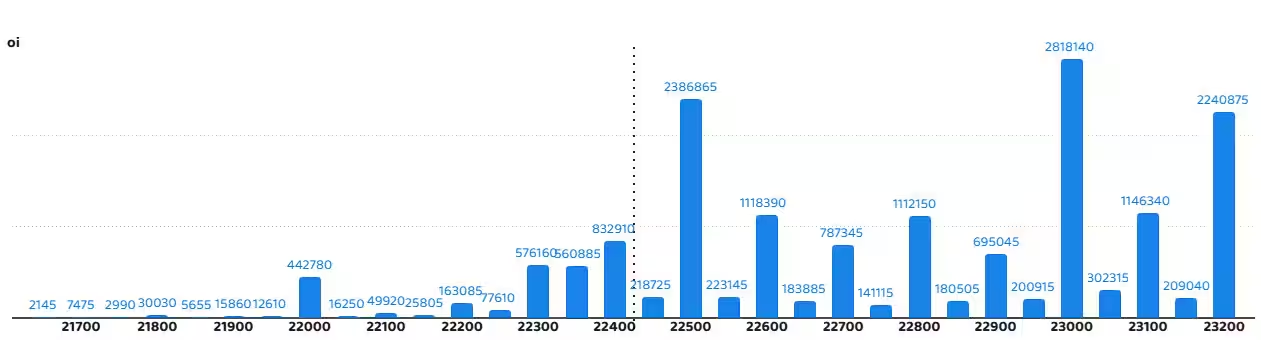
3) Nifty Call Options Data
According to the monthly options data, the maximum Call open interest was seen at the 23,000 strike (with 28.18 lakh contracts). This level can act as a key resistance level for the Nifty in the short term. It was followed by the 22,500 strike (23.86 lakh contracts) and 23,200 strike (22.4 lakh contracts).
Maximum Call writing was observed at the 22,500 strike, which saw an addition of 21.19 lakh contracts, followed by the 23,200 and 23,000 strikes, which added 13 lakh and 12.11 lakh contracts, respectively. There was hardly any Call unwinding seen in the 21,700-23,200 strike band.
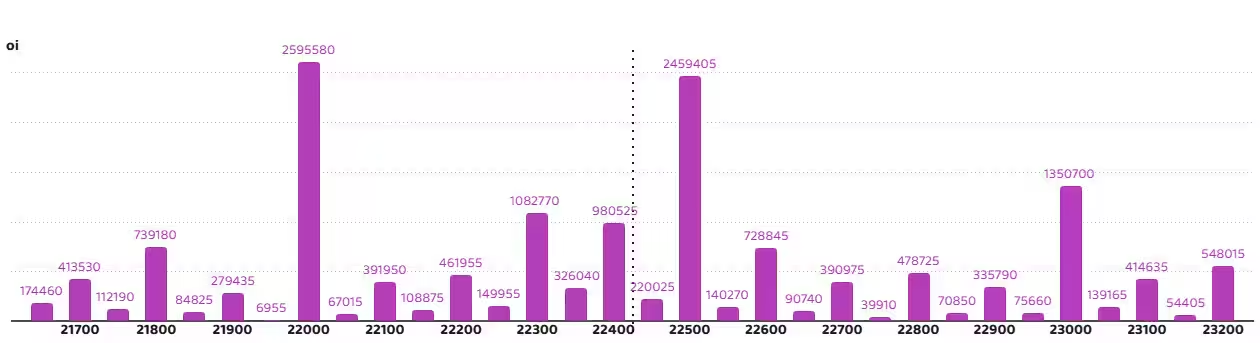
4) Nifty Put Options Data
On the Put side, the 22,000 strike holds the maximum Put open interest (with 25.95 lakh contracts), which can act as a key support level for the Nifty in the short term. It was followed by the 22,500 strike (24.59 lakh contracts) and the 23,000 strike (13.5 lakh contracts).
The maximum Put writing was placed at the 22,500 strike, which saw an addition of 11.51 lakh contracts, followed by the 22,000 and 22,300 strikes, which added 9.54 lakh and 8.84 lakh contracts, respectively. The maximum Put unwinding was seen at the 22,800 strike, which shed 3.17 lakh contracts, followed by the 23,100 and 22,900 strikes, which shed 3.08 lakh and 2.89 lakh contracts, respectively.
5) Bank Nifty Call Options Data
According to the monthly options data, the maximum Call open interest was seen at the 51,000 strike, with 3.09 lakh contracts. This can act as a key resistance level for the index in the short term. It was followed by the 52,000 strike (2.85 lakh contracts) and the 50,000 strike (1.5 lakh contracts).
Maximum Call writing was observed at the 51,000 strike (with the addition of 2.75 lakh contracts), followed by the 51,500 strike (96,090 contracts) and 50,500 strike (94,890 contracts). There was hardly any Call unwinding seen in the 49,000-52,250 strike band.
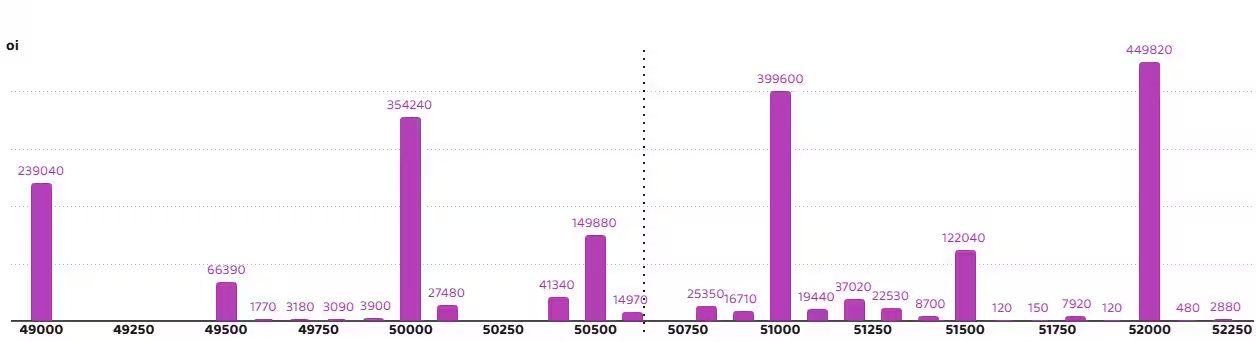
6) Bank Nifty Put Options Data
On the Put side, the 52,000 strike holds the maximum Put open interest (with 4.49 lakh contracts), which can act as a key level for the index. This was followed by the 51,000 strike (3.99 lakh contracts) and the 50,000 strike (3.54 lakh contracts).
The maximum Put writing was placed at the 51,000 strike (which added 1.84 lakh contracts), followed by the 50,000 strike (1.51 lakh contracts) and 49,000 strike (1.18 lakh contracts). The maximum Put unwinding was seen at the 52,000 strike, which shed 85,980 contracts.
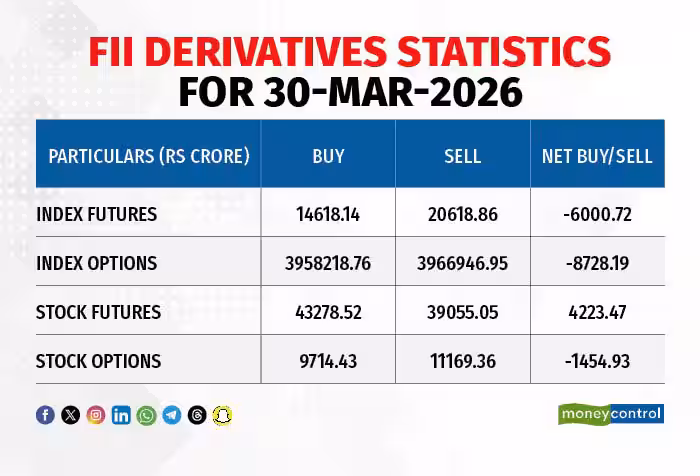
7) Funds Flow (Rs crore)
8) Put-Call Ratio
The Nifty Put-Call ratio (PCR), which indicates the mood of the market, fell to 0.92 on March 30, compared to a 0.94 in previous session.
The increasing PCR, or being higher than 0.7 or surpassing 1, means traders are selling more Put options than Call options, which generally indicates the firming up of a bullish sentiment in the market. If the ratio falls below 0.7 or moves towards 0.5, then it indicates selling in Calls is higher than selling in Puts, reflecting a bearish mood in the market.